August 23, 2017
By Jenny Par, Loyola University Chicago.
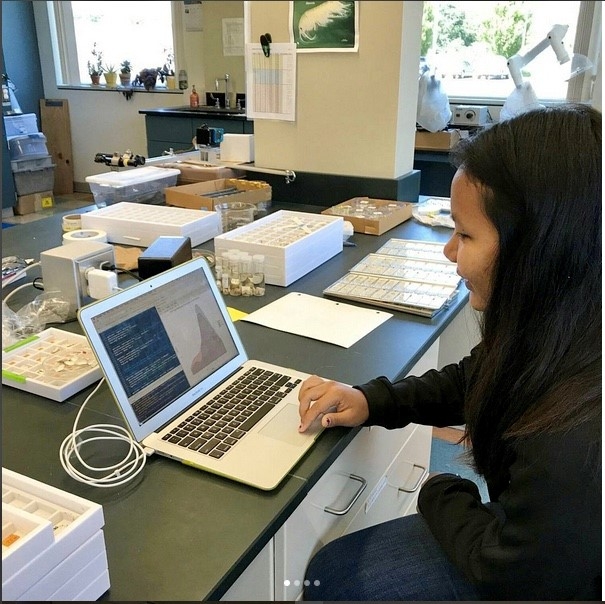
Fig. 5. Using RStudio to create different graphs to help visualize my results
This summer, I worked at the National Oceanic and Atmospheric Administration’s Great Lakes Environmental Research Laboratory (GLERL) with Dr. Ashley Elgin and Dr. Ed Rutherford. This was my second year working as an intern at NOAA GLERL. In both years, my project focused on invasive dreissenid mussels (i.e., quagga and zebra mussels). The colonization of both quagga and zebra mussels in the Great Lakes has profoundly impacted the Great Lakes ecosystem. They have out-competed other native mussel species and changed the nutrient dynamics and the food web. Therefore, it is important to gather as much information about these mussels in order to understand their impacts and improve management strategies.
For my project, I analyzed dreissenid mussels that were hand-collected by divers during Summer 2010 along transects at 2, 3, 4-meter depths in Saginaw Bay in Lake Huron. These samples were originally collected as part of a study led by Dr. Scott Peacor from Michigan State University and Dr. Steven Francoeur from Eastern Michigan University. Their goal was to look at spatial and temporal patterns of macroscopic benthic primary producer biomass, production and composition in Saginaw Bay.
I sorted and identified the mussels to species (quagga or zebra mussels) using distinguishing shell features (Fig. 1). I then measured the sizes of the mussel by first imaging them on flatbed scanner (Fig. 2). The images of the mussels were then analyzed using a custom IDL (Interactive Data Language) program called “Zebra Pro”. The program outputs the size, length, and width of each mussel, plus the total count of quagga and zebra mussels in each sample.
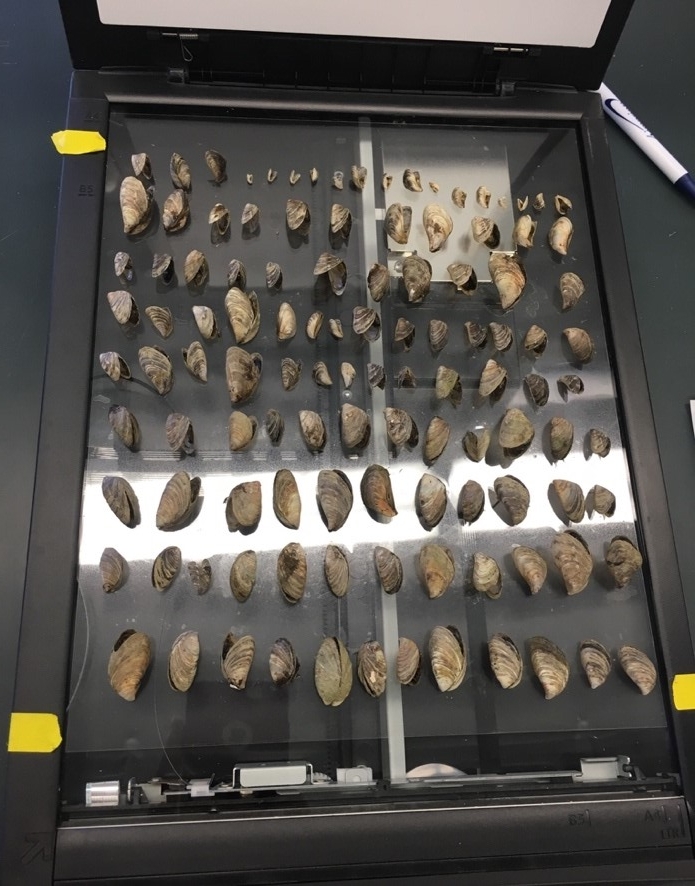
Fig 2. Mussels lined up on flatbed scanner for imaging
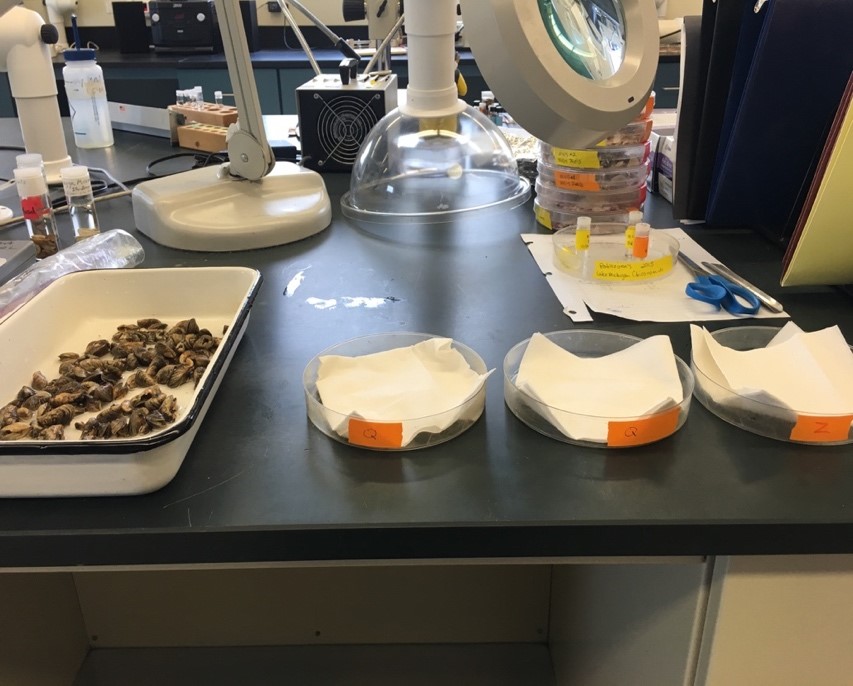
Fig 1. Sorting quagga and zebra mussels
Towards the fourth week of the program, I finished up the mussel scans and started my data analysis. I would definitely have to say that this was the hardest part of the project for me. Since I don’t have a lot of background in statistics, I had a difficult time figuring out what statistical analysis I would need to use to help answer my research questions. But, the process of analyzing my data made me feel like I was getting closer to becoming a researcher.
Last summer, I mainly focused on analyzing the densities and relative proportions of quagga and zebra mussels over depth and time. However, this year I looked for significant trends in the length distributions of each species. I found that quagga mussels at Transect 13 had similar length distribution patterns throughout the months, where the highest peak for the months falls within 15 to 17 mm (Fig. 3). As for transect 14, there’s a slight decrease in the peak length for quaggas. On the other hand, looking at the length distributions for zebra mussels, the highest peak doesn’t always fall within a similar size interval, but there is a distinct peak for each month. It is also important to note that there are significantly fewer zebra mussels than quagga mussels. Due to the low number of zebra mussels, this could be a reason why there is more variation in their length distribution for each month.
I also looked for evidence of Round Goby predation on dreissenids, as inspired by a recent paper from Foley et al. (2017. Journal of Great Lake Research 43:121-131), which analyzed the relationships between Round Goby abundances, size distributions, diet contents, and diet selectivity along with mussel length distributions in Saginaw Bay. The sites where the samples Foley et al. collected were in the same general proximity as the transects I studied. I started out by comparing my mussel size distribution data to that reported by Foley et al. (Fig. 4). The top row of their figure shows that mussels collected from the environment exhibit a bimodal distribution throughout the months, indicating that there are two distinct size groups of dreissenid mussels. In contrast, the bottom row of the figure shows that mussels found in Round Goby diets are mostly smaller than 10mm, indicating a preference for smaller mussels. However, my data shows unimodal distributions for mussels collected from May to August from Transects 13 & 14 (Fig. 3).
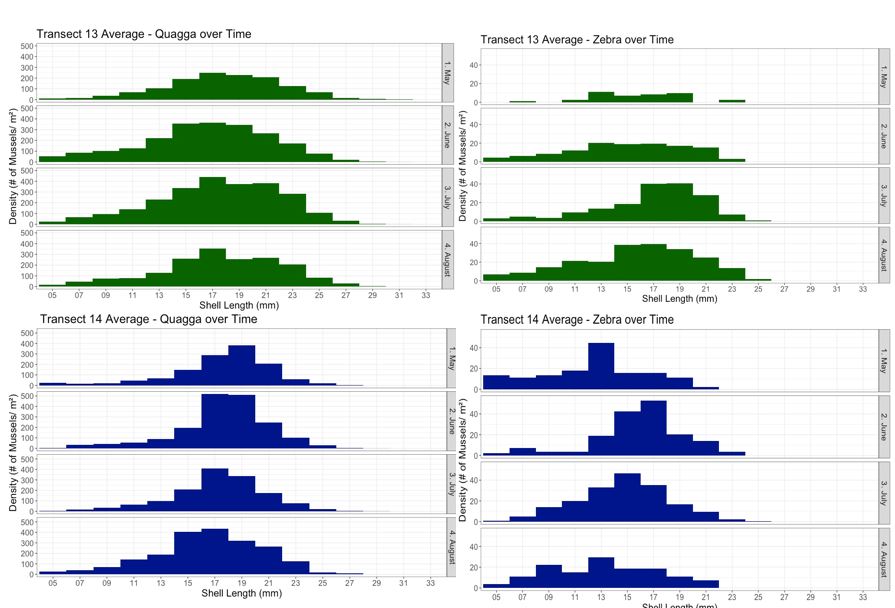
Fig. 3. Length distributions of quagga and zebra mussels from Saginaw Bay by month in 2010. Mussels were pooled across depths
One possible explanation for the absence of the smaller peak of mussels at my sites could be that Round Gobies are consuming them, which could potentially be a mechanism for the declines observed in the Saginaw Bay mussel population since the 1990’s. One way to investigate this in a future study would be to conduct a field experiment using Round Goby exclosures, and track how mussel size distributions change over the season.
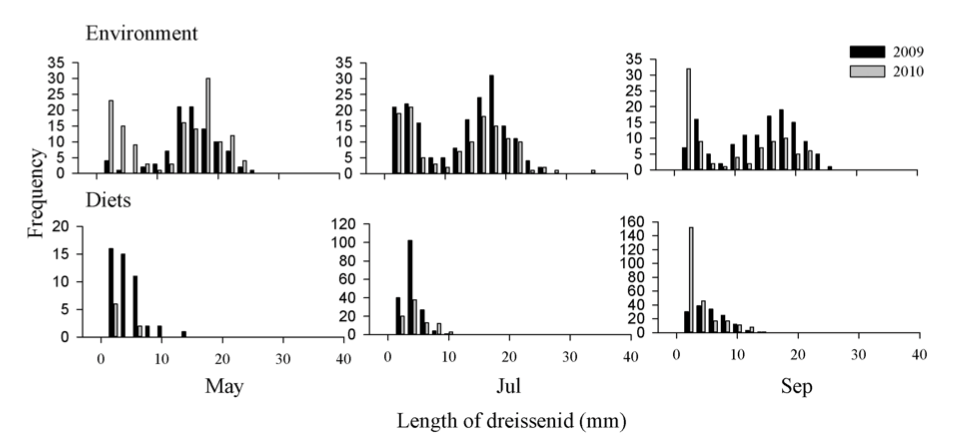
Fig. 4. Length distributions of dreissenids collected from the environment (via PONAR) and observed in round goby diets. Figure reproduced from Foley et al. 2017
Although there were many times I was completely frustrated and confused about my data, I would immediately become encouraged and motivated again once I was able to fix one of the problems. This summer, I learned the power of statistical analysis and the importance of critical interpretation of scientific papers. Through this whole process, I felt like I experienced what it truly meant to be a researcher. In a way, this research made me excited for my future research projects.
In addition, having mentors that guided me through my project was extremely beneficial. It was comforting to know that whenever I become baffled over my data, I could turn to Dr. Elgin or Dr. Rutherford for some guidance. After being exposed to the successes and challenges of conducting research during this internship, I now have a clearer vision of what I want to do in the future.